Man-in-the-middle for mitmproxy
This is about how I analyzed
this bug in mitmproxy
and learnt something new.
Normally, python programs can be debugged with the pdb.set_trace. But this
time, since mitmproxy uses a window based UI, the attempts to debug crumbled
up the UI and the keystrokes were still being recorded by the UI loop.
Then a quick search gave way for the remote debugger in Python, and these two lines of codes did the trick for me:
	from remote_pdb import RemotePdb
	remote_debugger = RemotePdb('127.0.0.1', 4444)
	.....
	remote_debugger.set_trace
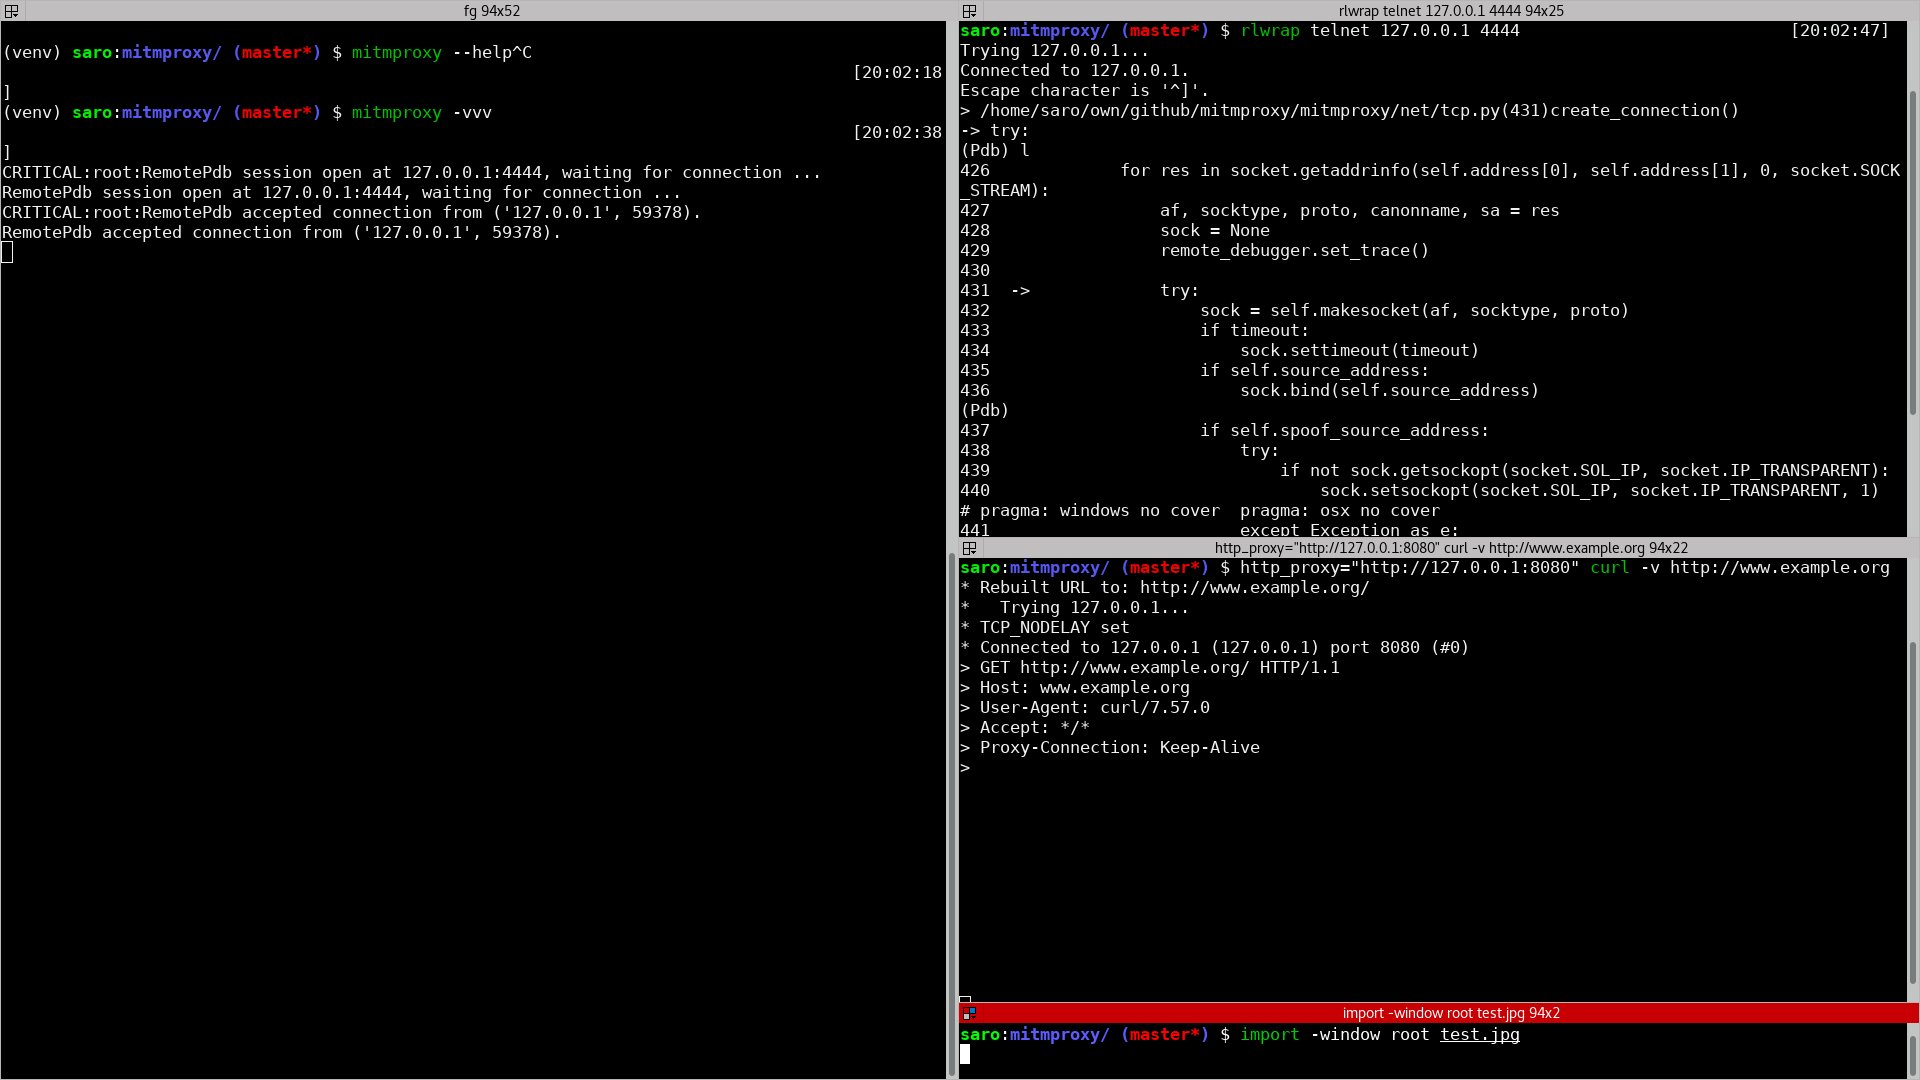
Then, on a separate window, trigger telnet to listen on the port 4444. Voila,
a clean, non-cluttered debugging environment for you to explore.

Here, you can see the entire process setup on my machine. This enabled me to have a detailed look at the bug.